Several years back I was looking for a good way to keep track of my annual cycling mileage and a little Googling resulted in finding this
website and it's link to a downloadabe Excel spreadsheet for keeping track of cycling mileage. Mark Pankin, who created that Excel doc annually updates the document and makes it available to the public. I think the document is great and I've used it for several years. One issue I did have with it though was gaining access to the document remotely. I kept it on my computer at home but sometimes I wanted to update it when I was not at home or just pull data from it, again when I wasn't at home.
I had had some email exchanges with Mark to ask about certain features of his document and this led to a discussion about porting the document over to Google Docs. Mark was not a Google Docs user but he didn't mind at all if I created a document using his Excel spreadsheet as a model. While there is some ability to import and export Excel format documents on Google Docs, Mark's spreadsheet was too complex to import intact, so I started from scratch, but as mentioned used Mark's Excel version as a model. I've added a number of features to the Google Docs version on top of what Mark had in place, and for a number of other functions, I had to recreate them using the Google Docs syntax. While Google Docs spreadsheets are not as robust as Excel, I think a very functional document emerged from the work.
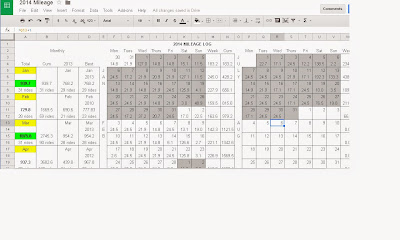
In the Google Docs spreadsheet I created, there is a tab for 2014 mileage, and also I've gone ahead and created the 2015 tab as well with links between the tabs so that the previous year and previous best columns are auto populated beginning with 2015. It is fairly easy to create a new tab for each year. There are a handful of functions to either move from one cell to another, or to update. The demarcation between months was done by using thick borders in the Excel version, but on the Google Docs version I've used shading. Either works, but for each new tab I'll need to edit the shading for each month first (as Mark did with the borders).
The enhancements I've made include the table and chart of average weekly mileage at the bottom of the document, as well as some automatic shading in column A, the current monthly totals column.
I retain all rights to the document. You are free to make personal use of a copy of the document. No commercial use of this is allowed without permission.
Below are some details about the document and how to use it.
The Google Docs Spreadsheet is presented in view mode to anyone with the link. You can copy the document to your own Google Docs and begin test driving it. You only need to add your daily mileage under the appropriate dates (except columns C and D on the '2014' tab where you'll enter some historical data if you have it). All the rest is automatic.
Take a look at the two tabs, '2014' and '2015', that come with the initial version of the document. Both tabs will initially have all the formulas and functions active, but no data has been entered. On the '2014' tab, find cell H4 (this is where your mileage for January 1, 2014 would go), and enter the value 52 there. Note that not only did the contents of that cell change, but also all of the following:
-
the weekly total for that week (cell M4)
-
the running totals for the year (columns N and X)
-
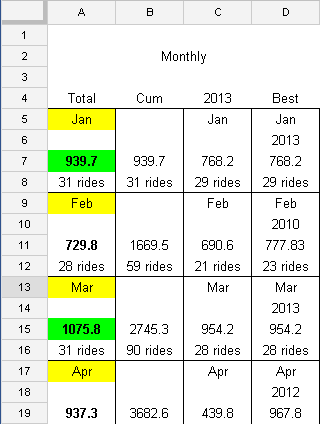
cells A7, A8 (current month's tally and # of rides)
-
values in column B (cumulative miles)
Note also that the shading of cell A5 is now Yellow, and A7 is now Green. In Column A, the name of the Month is highlighted when the total for that current month exceeds the total for the same month in the previous year. The total mileage for the month is highlighted green when it exceeds the previous best total for that month. In this case, the previous year's total for January (column c) and the historical best (column d) were both initially set to zero. Take a quick look at tab '2015' and you'll see that columns C and D have changed, with the data from tab '2014' carried over to tab '2015'. If you change those zeros on tab '2014' in cells c7 and d7 to 53, you'll see the highlighting in column A disappear and cells in columns C and D change on tab '2015'.
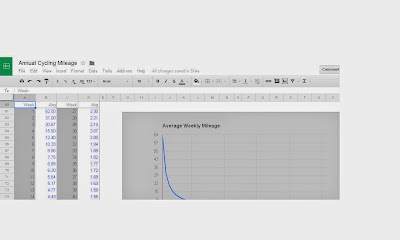
At the very bottom of the spreadsheet, there is a table and a chart which include data about weekly averages. When tab '2014' cell H4 was set to 52, you saw that the table had averages calculated through the end of the year and the chart showed the graphical representation of those averages. While cell H4 is 52, go to cell G4 (the last day of the previous year) and enter 10. If you look at the values in M4 and N4 (total for the current week and cumulative total respectively) you'll see that those still show 52. However, on the table of weekly averages beginning in cell B61, you'll see the averages start with 62 miles. It only makes sense that any given week for the weekly averages is comprised of 7 days, so we will count mileage from December 30th and 31st, 2013 for the first 'week' in the table and chart at the bottom of tab '2014'. For these weeks that split over two years, I include the 'week' in with the year which has the most days of that week, so for the last two days of 2013 and the first 5 days of 2014, the 'week' is included on tab '2014'.
Please feel free to comment. Thanks.


Comments
...Martin